A Nigerian’s illness carries more than pain or discomfort. It often comes with a financial burden that many households are barely prepared for. From buying paracetamol at a neighborhood pharmacy to paying for treatment in a private hospital, monthly health spending varies drastically across the country. But how much are people really spending every month? And what does that say about access to healthcare in Nigeria? After analyzing nationally representative household data, we found clear patterns. No assumptions, no speculation just data. It is important to note that this analysis focuses non–health insurance expenditures. In simpler terms, it reflects what households directly pay for healthcare each month, excluding any expenses covered by public or private health insurance schemes.
National Monthly Average Health Spending? About ₦8,432 per Household
Across the 36 states and the FCT, households spend an average amount of ₦8,432 every four weeks on healthcare. The number appears modest at first glance, but it conceals massive regional and state-level differences.
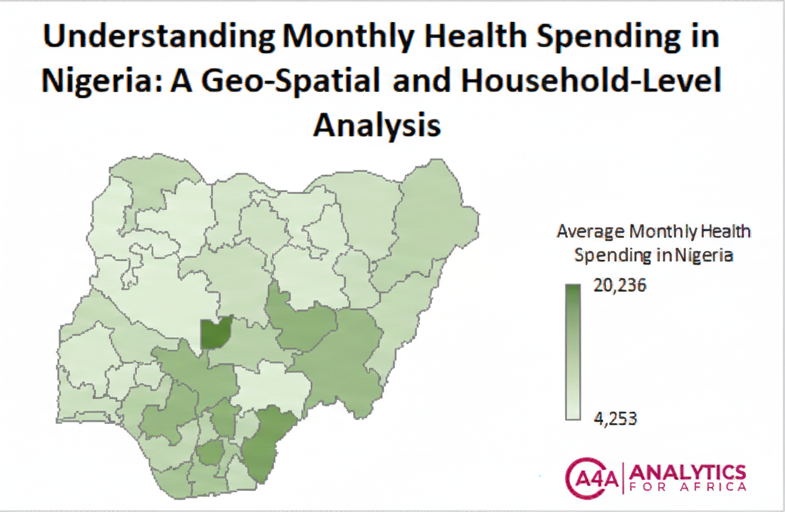
Figure 1: Same Country, Different Worlds

Spending in the South East and South South is significantly higher than the national average. These regions record average monthly spending of about ₦10,941 and ₦10,692 respectively. North Central also stands out at ₦10,216. On the other end of the spectrum, the North West has the lowest monthly average at just ₦5,758. That gap is not trivial; it signals profound differences in affordability, availability, and health-seeking behavior.
Figure 2: States That Spend the Most on Health Monthly
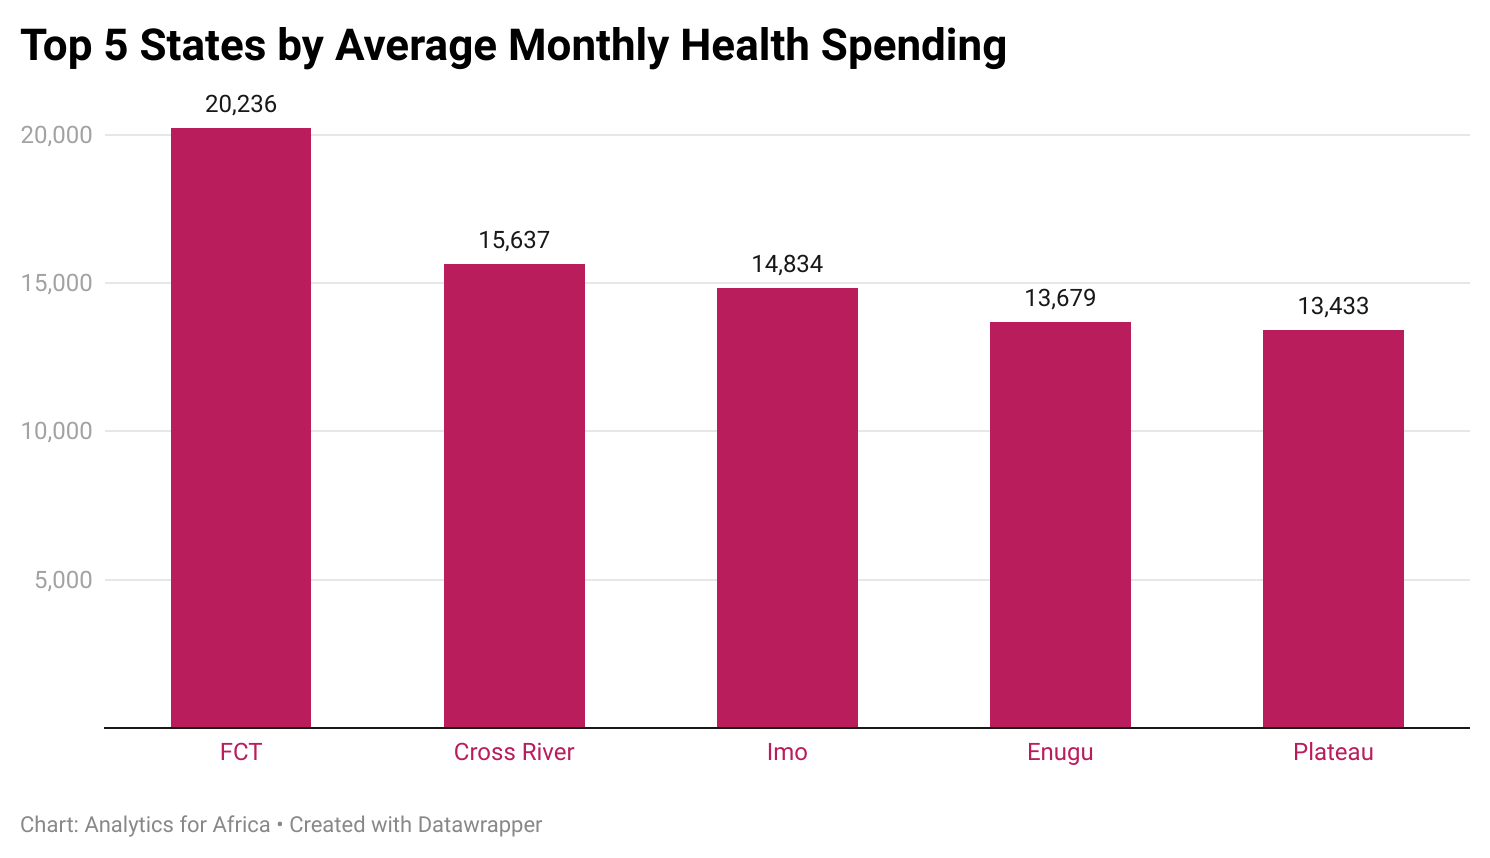
An immediate outlier is the FCT. With households spending about an average of ₦20,236 every four weeks, the FCT sits far above the rest of the country. This reflects both higher living costs and greater access to private healthcare facilities. Wealthier states and those with more urbanized environments tend to spend more, and the South South and South East also feature prominently. States like Cross River, Imo, and Enugu show relatively high monthly spending, mirroring stronger access to organized medical services.
Figure 3: States with the Lowest Monthly Health Spending
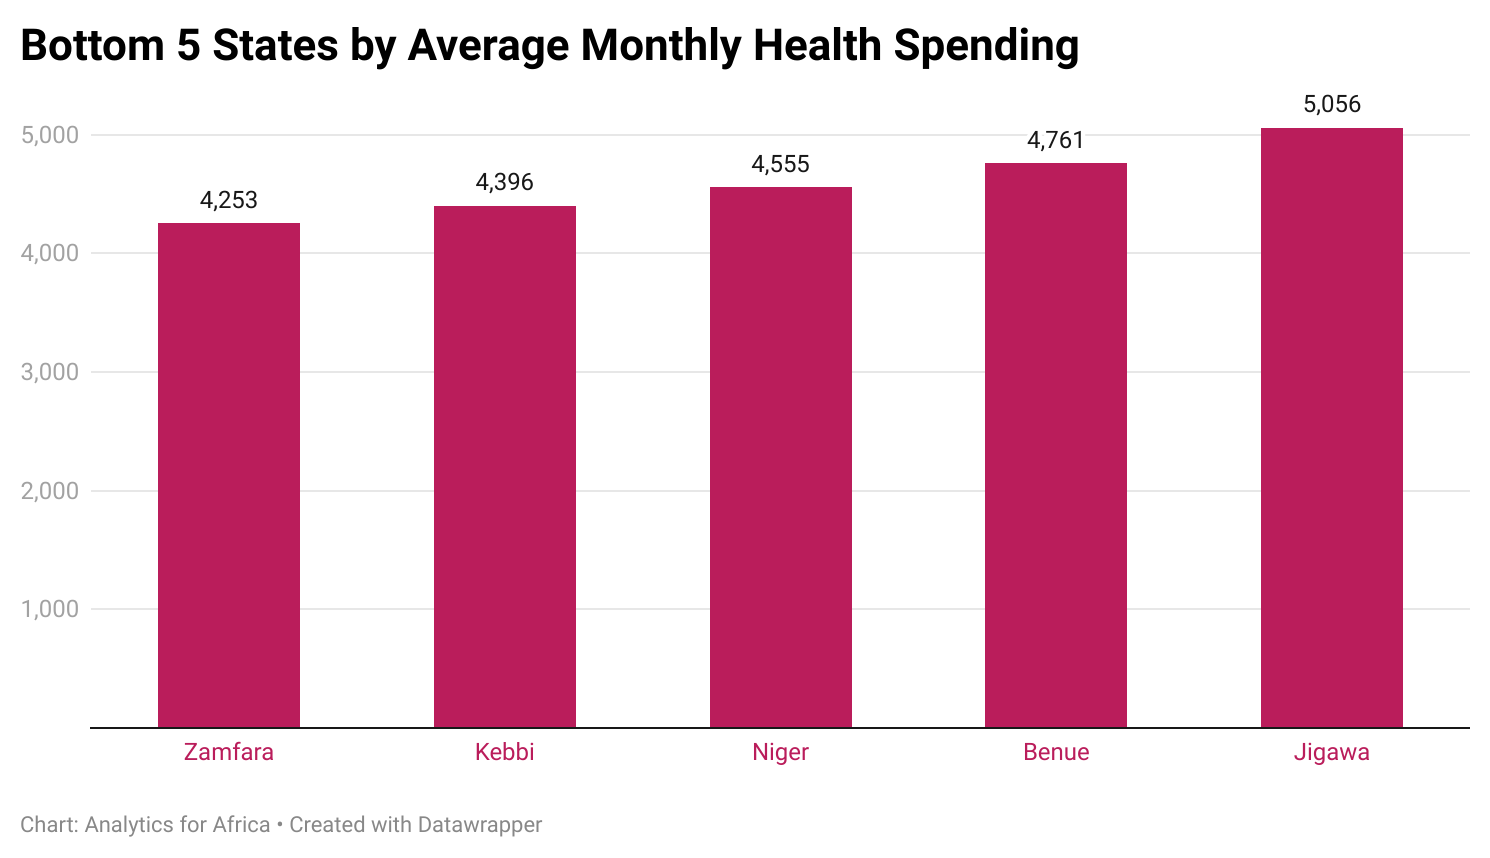
At the lower end of the spectrum, several states continue to exhibit significantly lower average monthly health expenditures, reflecting both income constraints and differences in health-seeking behavior. The lowest figures in the dataset place Zamfara at the bottom with an average monthly health spending of ₦4,253. Kebbi follows closely with ₦4,396, while Niger records ₦4,555. Benue appears next at ₦4,761, and Jigawa completes the group with ₦5,056. These figures indicate comparatively restricted household spending capacities, which may limit timely access to formal health services and contribute to varying health outcomes across regions.
The map of Nigeria illustrates these disparities even more clearly, showing how average monthly health spending varies from state to state and revealing the visual contrast between high-spending states and low-spending states.
The disparities are stark. People in the South East and South South tend to spend more due to higher incomes, better facilities, and more urban environments. Meanwhile, in some parts of the North West and North Central, households may forgo treatment, delay hospital visits, or rely instead on cheaper traditional options.
And then there is the FCT, where spending reflects a concentration of wealth, elite hospitals, and a population that can afford modern care. It presents a picture of what healthcare access could look like if equity were prioritized across all states.
What This Means
This is not just a set of numbers. High or low spending does not automatically translate to good or bad health outcomes. A region with low spending is not necessarily healthier. In fact, low spending often means people cannot afford to seek care when they need it. It means delayed treatment, untreated infections, and preventable complications. If these gaps persist, they will continue to shape health inequalities across Nigeria. A difference of even ₦4,000 in healthcare access can determine whether a person receives early care or ends up with a preventable emergency.
Health Spending – The Bottom Line
We often argue about the economy, elections, fuel prices, and everything in between. But conversations about how Nigerians actually access healthcare especially when sick rarely get the attention they deserve. Yet nothing is more fundamental. Where you live should not determine your chances of receiving medical care. Every Nigerian deserves timely, affordable treatment, whether they live in Yola or Yenagoa.
Data and Methodology
The data used in this analysis comes from the Nigeria General Household Survey (GHS) Panel Survey Wave 5 (2023/2024), implemented by the National Bureau of Statistics (NBS) in collaboration with the World Bank’s LSMS-ISA program. For this study, only the post-planting questionnaire data was used. This dataset includes detailed, self-reported monthly spending on healthcare specifically transactions such as payments for treatments, clinic visits, medications, laboratory tests, and other health-related services. Importantly, these amounts do not include any form of health-insurance premiums, meaning the reported averages capture only health expenditures excluding health insurance. Using these variables, household-level expenditures were aggregated and then used to generate three tiers of spending estimates: household averages, state averages, and geo-political zone averages. All figures presented represent monthly (four-week) spending.